
June 29, 2016
Setup Ionic 2 + TypeScript Debugging with IntelliJ/WebStorm/Jetbrains IDE
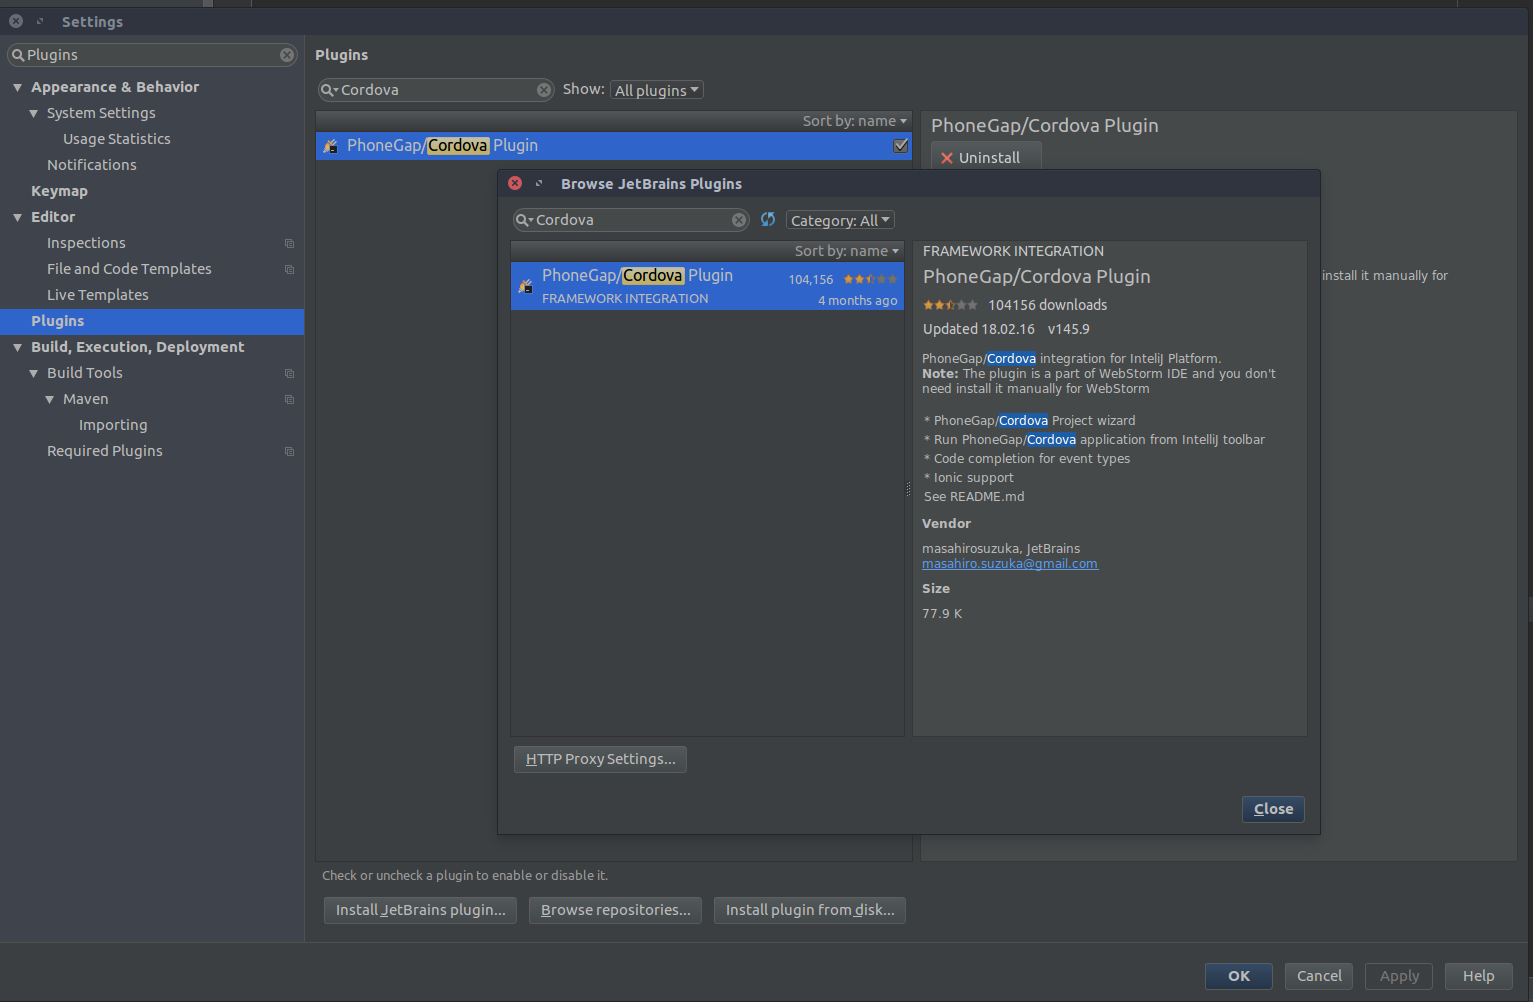
Setting up Ionic 2 debugging is pretty easy. Above all make sure to have the “Phonegap/Cordova” Plugin installed when you want to start Ionic from Run. To do so go to Settings -> Plugins -> Install JetBrains plugin and search for “cordova”.
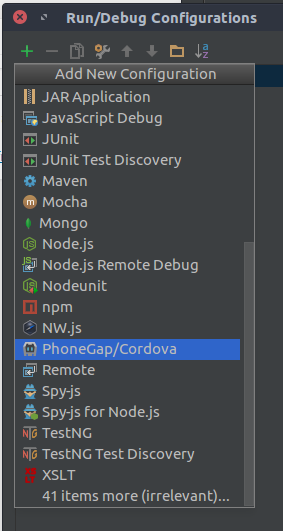
Next step is to enable Run Cordova, go to Run -> Edit Configuration and use the green plus icon on the top right corner of the window to add a new configuration. Scroll down and select “PhoneGap/Cordova”.
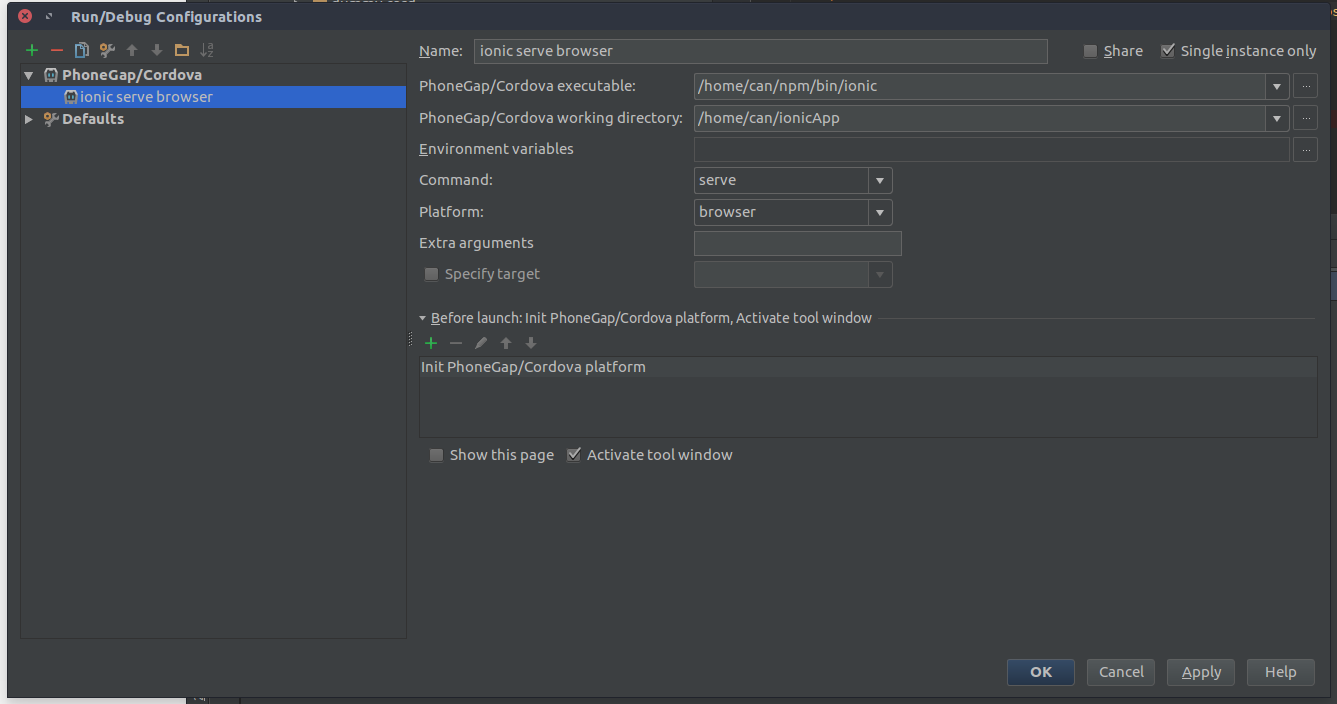
For now we only want to add the ionic serve task to the run method. Later you can add run Android, Windows Phone and iOS by yourself. Now set name and command and platform as seen in the screenshot:
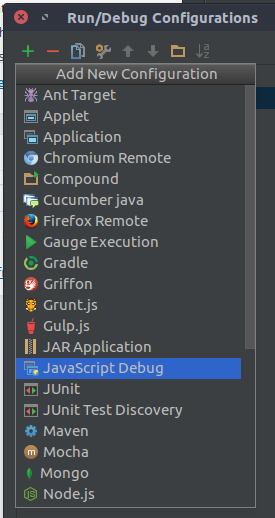
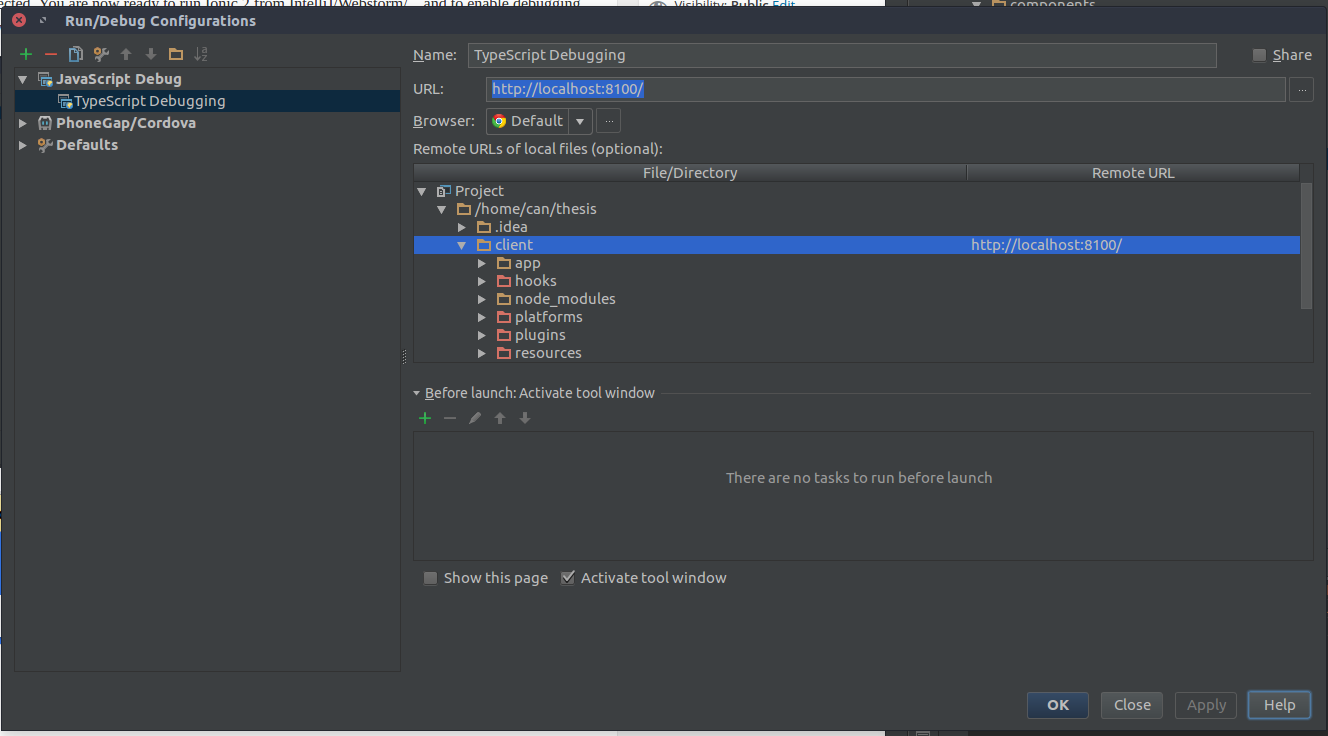
We can run Ionic 2 serve now via our IDE. In order to add the TypeScript debugging click the green plus again and select “JavaScript Debugging”:
Name the newly created debugger and choose URL and browser – for me chrome and localhost:8100. Then add the folder mapping of the Remote URL localhost:8100 to the folder containing your ionic project ( where your package.json is ). Your IDE needs this setting to understand how the generated sources and the originally sources are connected.
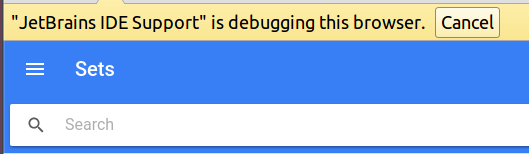
You are ready to run Ionic 2 from IntelliJ/Webstorm/… and to enable debugging. Make sure to have the browser extension installed:
Problems?
My breakpoint is not working:
- Make sure that the connection between IDE debugger and browser is ok. To do so go to the debug tab and type “alert(1);”. This should trigger an alert in your browser window.
- make sure to have the path to URL mapping correctly in the debug config
If IntellJ/Webstorm recognizes the breakpoints and is able map it to a file the breakpoint changes its look and shows a checkmark on the red dot.
Note to especially to WebStorm and PyCharm:
I received feedback from a Ionic 2 user experiencing issues with the debug configuration in PyCharm and WebStorm (2016.2). He managed to get rid of the problem by adding some more remote URL mappings:
|
1 2 3 |
URL of the debugging config: https://localhost:8100 URL for the project's root directory: http://localhost:8100/source URL for the "www" directory: http://localhost:8100 |
See this thread for further information:
https://forum.ionicframework.com/t/debugging-in-webstorm/52563/2
Admin Admin
Developer at 
Thank for article, js/ts debug in websorm/pystorm is fantastic!
Thanks for the information! I wasn’t able to get breakpoints working though. Have any other tips to get that working?
I know this is a month old, but I had to edit the package.json and add:
“config”: {
“ionic_bundler”: “webpack”,
“ionic_source_map”: “source-map”
}
Without it, the file mappings wouldn’t work and neither would breakpoints.
in “\node_modules\@ionic\app-scripts\config\webpack.config.js”
line: 46
function getDevtool() {
if (process.env.IONIC_ENV === ‘prod’) {
// for now, just force source-map for prod builds
return ‘source-map’;
}
return process.env.IONIC_SOURCE_MAP;
}
add to env IONIC_SOURCE_MAP=’source-map’
or change
module.exports = {
….
line: 62 devtool: getDevtool(),
to
devtool: ‘source-map’,
Then debug started working.
Thanks for sharing
you made my day, thanks !
This works fine to debuggin with browser but how can configure intellij to debugging directly typescript with a real device?